
|
Is The Location of Where Your Data Is Stored Important To You?
0 Comments
Kilo, Mega, and Giga. What's next? As we deal with more data, we deal with more zeroes. We have kilo, mega, giga and so on, but how big are they or how many zeroes do they carry? Will we run out of words to deal with more zeroes? I found a table of SI Prefixes to share with all: 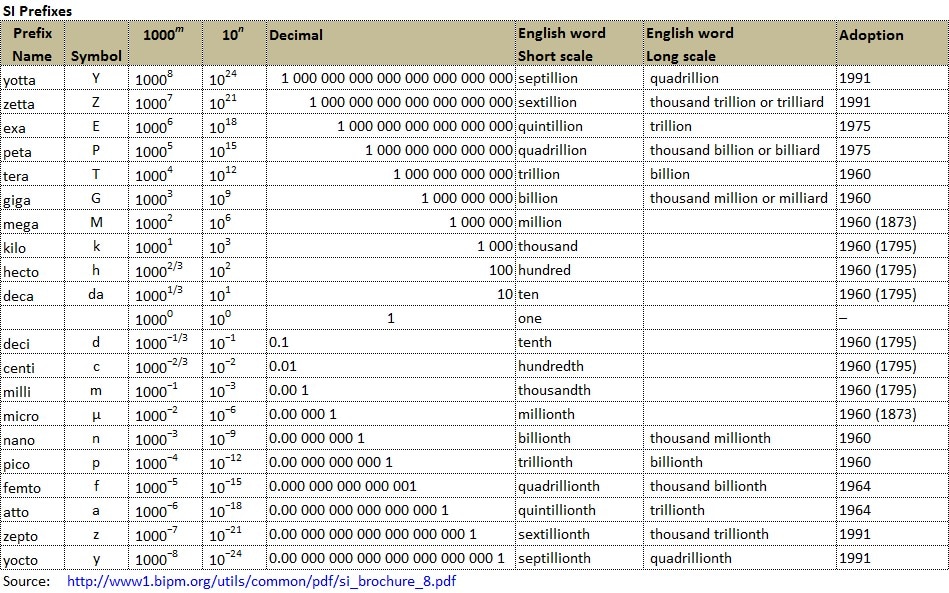 Big Data at a Top 5 Property and Casualty Insurer
Started in 1922 by a handful of military officers who offered to insure each other’s vehicles when no one else would, the insurer has become a financial services powerhouse, offering a broad range of insurance and banking services to military members and their families. The size of its customer base and breadth of products make big data a natural next step in the company’s already-advanced technology portfolio. Consistently named one of the country’s best places to work and lauded for its many customer service awards, the insurer has made understanding customer behaviors and preferences core to its mission. “We have a strategy of continuing our evolution as a ‘relationship’ company,” explained the Lead Information Architect in the insurer’s BI Lab and one of the visionaries behind the company’s big data roadmap. “This means taking into account as many data sources as possible, and being able to harness as many new types of data as we need.” In addition to cultivating a deeper view into customers’ product needs and service preferences, the insurer is using a new crop of big data solutions for fraud detection—monitoring data patterns to pinpoint “points of compromise”—using telematics data to provide in-vehicle service, and sensory telemetry information for its mobile apps. Source: Big Data in Big Companies, Thomas H. Davenport and Jill Dyché, May 2013 (Go to Suggested Readings to view full article) Big Data at Bank of America
Given Bank of America’s large size in assets (over $2.2 trillion in 2012) and customer base (50 million consumers and small businesses), it was arguably in the big data business many years ago. Today the bank is focusing on big data, but with an emphasis on an integrated approach to customers and an integrated organizational structure. It thinks of big data in three different “buckets”—big transactional data, data about customers, and unstructured data. The primary emphasis is on the first two categories. With a very large amount of customer data across multiple channels and relationships, the bank historically was unable to analyze all of its customers at once, and relied on systematic samples. With big data technology, it can increasingly process and analyze data from its full customer set. Other than some experiments with analysis of unstructured data, the primary focus of the bank’s big data efforts is on understanding the customer across all channels and interactions, and presenting consistent, appealing offers to well-defined customer segments. For example, the Bank utilizes transaction and propensity models to determine which of its primary relationship customers may have a credit card, or a mortgage loan that could benefit from refinancing at a competitor. When the customer comes online, calls a call center, or visits a branch, that information is available to the online app, or the sales associate to present the offer. The various sales channels can also communicate with each other, so a customer who starts an application online but doesn’t complete it, could get a follow-up offer in the mail, or an email to set up an appointment at a physical branch location. A new program of “BankAmeriDeals,” which provides cash-back offers to holders of the bank’s credit and debit cards based on analyses of where they have made payments in the past. There is also an effort to understand the nature of and satisfaction from customer journeys across a variety of distribution channels, including online, call center, and retail branch interactions. The bank has historically employed a number of quantitative analysts, but for the big data era they have been consolidated and restructured, with matrixed reporting lines to both the a central analytics group and to business functions and units. The consumer banking analytics group, for example, made up of the quantitative analysts and data scientists, reports to Aditya Bhasin, who also heads Consumer Marketing and Digital Banking. It is working more closely with business line executives than ever before. Source: Big Data in Big Companies, Thomas H. Davenport and Jill Dyché, May 2013 (Go to Suggested Readings to view full article) Big Data at an International Financial Services Firm
For one multinational financial services institution, cost savings is not only a business goal, it’s an executive mandate. The bank is historically known for its experimentation with new technologies, but after the financial crisis, it is focused on building its balance sheet and is a bit more conservative with new technologies. The current strategy is to execute well at lower cost, so the bank’s big data plans need to fit into that strategy. The bank has several objectives for big data, but the primary one is to exploit “a vast increase in computing power on dollar-for-dollar basis.” The bank bought a Hadoop cluster, with 50 server nodes and 800 processor cores, capable of handling a petabyte of data. IT managers estimate an order of magnitude in savings over a traditional data warehouse. The bank’s data scientists—though most were hired before that title became popular—are busy taking existing analytical procedures and converting them into the Hive scripting language to run on the Hadoop cluster. According to the executive in charge of the big data project, “This was the right thing to focus on given our current situation. Unstructured data in financial services is somewhat sparse anyway, so we are focused on doing a better job with structured data. In the near to medium term, most of our effort is focused on practical matters—those where it’s easy to determine ROI—driven by the state of technology and expense pressures in our business. We need to self-fund our big data projects in the near term. There is a constant drumbeat of ‘We are not doing “build it and they will come’—we are working with existing businesses, building models faster, and doing it less expensively. This approach is more sustainable for us in the long run. We expect we will generate value over time and will have more freedom to explore other uses of big data down the road.” Source: Big Data in Big Companies, Thomas H. Davenport and Jill Dyché, May 2013 (Go to Suggested Readings to view full article) Big Data at Schneider National
Schneider National, one of North America’s largest truckload, logistics and intermodal services providers, has been pursuing various forms of analytical optimization for a couple of decades. What has changed in Schneider’s business over the past several years is the availability of lowcost sensors for its trucks, trailers and intermodal containers. The sensors monitor location, driving behaviors, fuel levels and whether a trailer/container is loaded or empty. Schneider has been transitioning to a new technology platform over the last five years, but leaders there don’t draw a bright line between big data and more traditional data types. However, the quality of the optimized decisions it makes with the sensor data – dispatching of trucks and containers, for example – is improving substantially, and the company’s use of prescriptive analytics is changing job roles and relationships. New sensors are constantly becoming available. For example, fuel-level sensors, which Schneider is beginning to implement, allow better fueling optimization, i.e., identifying the optimal location at which a driver should stop for fuel based on how much is left in the tank, the truck’s destination and fuel prices along the way. In the past, drivers have entered the data manually, but sensor data is both more accurate and free of bias. Safety is a core value at Schneider. Driving sensors are triggering safety discussions between drivers and their leaders. Hard braking in a truck, for example, is captured by sensors and relayed to headquarters. This data is tracked in dashboard-based safety metrics and initiates a review between the driver and his/her leader. Schneider is piloting a process where the sensor data, along with other factors, goes into a model that predicts which drivers may be at greater risk of a safety incident. The use of predictive analytics produces a score that initiates a pre-emptive conversation with the driver and leads to less safety-related incidents. Source: Big Data in Big Companies, Thomas H. Davenport and Jill Dyché, May 2013 (Go to Suggested Readings to view full article) Big Data at UPS
UPS is no stranger to big data, having begun to capture and track a variety of package movements and transactions as early as the 1980s. The company now tracks data on 16.3 million packages per day for 8.8 million customers, with an average of 39.5 million tracking requests from customers per day. The company stores over 16 petabytes of data. Much of its recently acquired big data, however, comes from telematics sensors in over 46,000 vehicles. The data on UPS package cars (trucks), for example, includes their speed, direction, braking, and drive train performance. The data is not only used to monitor daily performance, but to drive a major redesign of UPS drivers’ route structures. This initiative, called ORION (OnRoad Integrated Optimization and Navigation), is arguably the world’s largest operations research project. It also relies heavily on online map data, and will eventually reconfigure a driver’s pickups and drop-offs in real time. The project has already led to savings in 2011 of more than 8.4 million gallons of fuel by cutting 85 million miles off of daily routes. UPS estimates that saving only one daily mile driven per driver saves the company $30 million, so the overall dollar savings are substantial. The company is also attempting to use data and analytics to optimize the efficiency of its 2000 aircraft flights per day. Source: Big Data in Big Companies, Thomas H. Davenport and Jill Dyché, May 2013 (Go to Suggested Readings to view full article) Big Data And The Future Of Real Estate Marketing
In The Wall Street Journal (WSJ), Stefanos Chen discusses how big data is being used in the real estate industry. He looks at the example of Jon Hoefling, a 50-year-old office-furniture resale company owner in Morgan Hill, California. Jon was thinking about selling his home and when he opened his Facebook page he saw an advertisement offering to estimate his home’s value. This is not coincidence. Jon was just one of the many residents in the area targeted by the real estate agent who paid for the advertisement using big data and a sophisticated algorithm who identified him as a potential seller. Chen says there were a number of indications which identified Jon as a prospective seller, such as he had lived in the area for more than 15 years, his home was valued high for the area, and most importantly, his youngest son was about to leave home for college. Jon’s information could have been collected in one of several different ways such as surveys, online audience tracking, industry statistics, subscriptions to publications he had, demographics, freely accessed public records and the list goes on. Real estate giant, Sotheby’s International Realty, recently announced a partnership with Wealth-X, a consulting group who use public records and research to find out more about the interests and habits of the world's wealthiest 1% by collecting data such as incomes, investments, hobbies, titles, affiliations, family members, news, tax records and much more. Using this data, Wealth-X helps clients such as JP Morgan, Barclays and McLaren, find prospective buyers for their products. They help agents determine who is most likely to be in the market for buying and selling, saving companies substantial time and money. Managing Partner at TTR Sotheby’s in Washington Mark Lowham told WSJ they engaged Wealth-X to find a buyer for a $9 million penthouse that was about to hit the market. Wealth-X first established the most likely description of their buyers: previous homeowners with a combined income of at least $2 million and had lived in a house worth more than $4 million for at least five years. They then got into specifics, such as targeting art collectors because there was ample wall space and private plane users because the area attracts jet-setters. Big data consulting firms such as Wealth-X use a combination of data from many sources to combine it with real estate contact database, then narrow down to a list of the most likely buyers, followed by leading a mail, email or calling campaign to the targeted buyers. While some real estate agencies are favouring the use of technology there are many that are concerned about the future roles of agents. Big Data at United Healthcare
United Healthcare, like many large organizations pursuing big data, has been focused on structured data analysis for many years, and even advertises its analytical capabilities to consumers (“Health in Numbers”). Now, however, it is focusing its analytical attention on unstructured data - in particular, the data on customer attitudes that is sitting in recorded voice files from customer calls to call centers. The level of customer satisfaction is increasingly important to health insurers, because consumers increasingly have choice about what health plans they belong to. Service levels are also being monitored by state and federal government groups, and published by organizations such as Consumer Reports. In the past, that valuable data from calls couldn’t be analyzed. Now, however, United is turning the voice data into text, and then analyzing it with “natural language processing” software. The analysis process can identify—though it’s not easy, given the vagaries of the English language - customers who use terms suggesting strong dissatisfaction. A United representative can then make some sort of intervention - perhaps a call exploring the nature of the problem. The decision being made is the same as in the past—how to identify a dissatisfied customer - but the tools are different. To analyze the text data, United Healthcare uses a variety of tools. The data initially goes into a “data lake” using Hadoop and NoSQL storage, so the data doesn’t have to be normalized. The natural language processing - primarily a “singular value decomposition”, or modified word count - takes place on a database appliance. A variety of other technologies are being surveyed and tested to assess their fit within the “future state architecture. United also makes use of interfaces between its statistical analysis tools and Hadoop. The work to put the customer satisfaction data, along with many other sources of customer data, into a customer data warehouse and analyze it is being led by Mark Pitts, who is based in the Finance organization. However, several other functions and units of United, including its Optum business specializing in selling data and related services to healthcare organizations, are participating. Pitt’s team includes both conventional quantitative analysts and data scientists with strong IT and data management skills. Source: Big Data in Big Companies, Thomas H. Davenport and Jill Dyché, May 2013 (Go to Suggested Readings to view full article) Google Uses Big Data to Provide Critical Information for Prompt Disease Control
Back in 2009, a new flu virus - H1N1 was discovered, and it spread quickly. In the United States, the Centers for Disease Control and Prevention (CDCP) requested doctors inform CDCP of new flu cases so that CDCP can take action to contain its spread. There were some problems on how fast information could be collated: 1. People might feel sick for a few days before seeing a doctor; 2. Reporting of new flu cases by doctors to CDCP was not immediate; and 3. CDCP only tabulated the information once a week. The above factors made the critical information for prompt disease control out of date by at least 2 weeks, at a moment where real time information is required. Google saw this as an opportunity to use its expertise in data analytic and access to vast amount of data to provide near real time information, by looking at what people were searching for on the Internet. Google took the 50 million most common search terms that Americans typed and compared the list with CDCP data on the spread of seasonal flu between 2003 and 2008, to look for correlations between the frequency of certain search queries and the spread of the flu over time and space. After processing a staggering 450 million different mathematical models, they found a strong correlation between their prediction and the official nationwide figures of CDCP in near real time, not 2 weeks after the event. The above illustrates that Google's system proved to be a more useful and timely indicator than government statistics with their inherent reporting lags. |
