
|
We are pleased to advise that MailGuard has blocked a number of fast breaking phishing emails that would otherwise be disastrous if users act on them. We share some screenshots below: 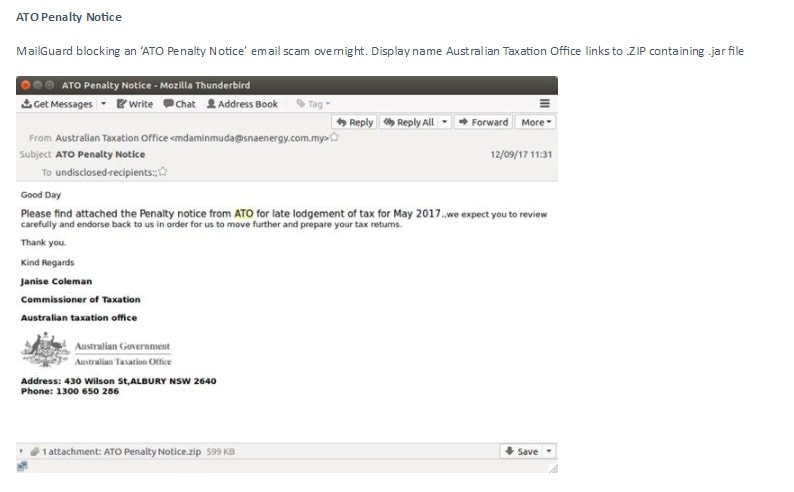  
0 Comments
Big Data in the O&G Industry
What do you understand by big data? Big data is the challenge that many industries, including oil and gas, face in handling large volumes of data and information, much of it diverse, unstructured, and increasingly real-time. When harnessed properly, big data is a big opportunity, offering enormous value through improved knowledge and decision-making. Why is it so important to E&P?Ahmed Hashmi, Global Head of Upstream Technology, BP.E&P is an intensely data driven, high technology business; it always has been, particularly in the subsurface. The data and knowledge we have about the fields we operate today, and from others in our past, inform our future developments, as well as providing analogues to other fields for new access. In operations, control of big data offers improvement in safety, efficiency and reliability: today our operational environments are enabled with hundreds of thousands of sensors, each transmitting performance data against a defined operational envelope, enabling us to adjust, optimise and increasingly to predict anomalies before they arise. What are BP’s big data plans?At BP, we have publicly stated our ambition to be the leading digital upstream company. Harnessing the power of data is key to this ambition. Over the past decade we have invested in subsea fibre to connect our operations to our centres of expertise, in high performance computing to crunch through massive volumes of subsurface data and in a proprietary data lake. Every day, twice as many data records enter the BP data lake than daily tweets on Twitter – and we plan a six-fold increase by 2020. We are building the Connected Upstream – connecting up our equipment, systems and people. It is BP’s Industrial Internet of Things. What is driving these plans?The E&P sector faces many challenges today, not least the lower oil price. There is still short- and long-term demand for oil and gas: the world needs our products, but it wants lower carbon energy, and renewables are now presenting a real alternative. The economics of our industry have changed – we need to adapt to succeed. Building the Connected Upstream and becoming the digital leader in our sector is part of our strategy to transform, and become more efficient, more resilient and create more value for our shareholders. Is the industry technologically at the forefront of big data?As a sector, we can often appear to be digital laggards. But there are pockets where we have moved further and faster than almost every other sector, including high performance computing. We have continuously invested in compute power over the past two decades to underpin our seismic processing capability. BP’s Centre for High Performance Computing is equipped with six petaflops compute capacity, and growing. Today, we run complex seismic algorithms in a week that would have taken us 2,000 years about 20 years ago. But while high performance computing is an acknowledged leadership area, in other areas we are building capability. For a long time our sensors were transmitting more data than we could handle; that is changing, with platforms like Plant Operations Advisor, a collaboration with GE using its world-class Predix systems – the first application for our industry. We have built a proprietary capability, using Distributed Acoustic Sensing with downhole fibre, to record sounds within our wells two miles below the seafloor to listen for sand which can constrain our ability to produce oil. Each hour we record a terabyte of data: the equivalent of downloading 1,000 Netflix films simultaneously. Today, not only can we record those data, but we can extract what’s valuable, visualise them, and make decisions from them. So the answer is, yes, we’re at the forefront in some areas, and catching up fast in others. Will big data and cloud computing change the industry?Big data – when coupled with the cloud, machine learning, AI, automation and even higher performance computing – is a big opportunity, but we need to be realistic. Right now, there is a lot of hype around digital, with claims of exponential value; 10x rather than 10% improvements. Delivering anything close to this magnitude of improvement will require the industry to throw out the rule book. It will need novel technology collaborations, fresh thinking around some of our established ways of working across the industry, skilling up our people in advanced analytics and getting our mindset to one of balancing physics-based approaches with data-driven solutions. Digital is already changing our industry; those who seize the opportunities it presents are likely to adapt best, become more resilient and create more value. Source: https://www.geoexpro.com/articles/2017/11/big-data-in-the-o-g-industry Disclaimer: The above article is published here in addition to providing a link in other pages of Big Data Space website so that visitors can still read the article in the event of having a broken link to the original article. 9 Big Data Applications
As the use of Big Data is increasing, the industry application is getting lower and lower. Very often, we will see some very innovative use of big data in improving our daily lives in many ways. How do we make use of Big Data in order to extract valuable insights from it and use it to or advantage? We will examine the 9 Big Data applications that are known to us today: 1, Big Data is improving our lives Big data is not just about businesses and governments, but also for individual like us. The wearable devices that we use capture a lot of good data about our daily lives, which can help monitor our health, lifestyle, activity, sleep pattern and quality, emotion and state of mind, and these data can be used to suggest improvement for us to live better. These data can even be used in finding our compatible partners in dating websites. 2, Business Process Optimisation Big Data also helps to optimise business processes. This can be achieved through the use of social media data, web search and weather forecast to dig out valuable data, which is the most widely used in optimising the Big Data supply chain and distribution channels. In both of these areas, geolocation and wireless tracking of goods and delivery vehicles, using real-time traffic route data to develop a more optimised distribution / delivery network 3, Understand the customers and their needs Currently Big Data is most widely used in this area. The focus is on how to use Big Data to better understand the customers, their interests and behaviour. Companies are very keen in collecting social data, browser logs, analysing text and sensor data, in order to better understand the customer. In most cases, data modellings are developed to perform predictive analysis. For example, the famous US retailer Target, through Big Data analysis, get valuable information to accurately to predict when customers want to have children. In addition, through the application of Big Data, telecommunication companies can better predict the reason for losing customers, Wal-Mart is more accurate in predicting when and what products will be selling well, the car insurance industry can better understand the needs of customers and driving skill, the Government can better understand voters preferences. 4, Improve Sports Performance Today, many athletes under training are using Big Data technology to analyse their performances for corrective measures, Such as the IBM SlamTracker tool for tennis matches. We also use video analytics to study the performance of each player in a soccer or baseball game, and sensor technology in sports equipment (such as basketball or golf club) allows us to obtain data on the game for future improvements. Many elite sports teams also track the activities of athletes outside their sports lives - by using smart technology to track their nutritional level and sleep quality, as well as social dialogue to monitor their emotional status. 5, Improve Medical Research and Development The computational power of Big Data analysis applications allows us to decode the entire DNA in a matter of minutes and enable us to develop the most effective treatment program. It also allows us to better understand and predict diseases. Big Data technology has been used in hospitals to monitor the condition of preterm and unwell babies. Through recording and analysing the babies heartbeat and other data, the doctor can predict when and where babies will feel discomfort and provide early treatment to ensure safe delivvery of babies. 6, Financial Transactions Big Data in the financial sector mainly applies to financial transactions. For example, High Frequency Trading (HFT) is an area where Big Data algorithms are used in conjunction with social media interactions and website news feed to reach transactional decisions in executing a buy or sell decisions in near real time. 7, Improve Our City Big data is also being used to improve the quality of our daily life in the city. This can be in the form of safer and smoother traffic condition for road users due to optimised operation of traffic lights based on analysis of real-time traffic data, social media interactions, and weather data. 8, Improve Security and Law Enforcement Big Data is now widely used in the process of security enforcement. We all know that the US Security Agency uses Big Data to predict possible terrorist attacks, and even monitors the daily lives of people with suspicious bahaviour and activity. companies use Big Data technology to defend against network attacks. Police use Big Data tools to help arrest criminals. Credit card companies to use Big Data tools to predict and alert possible fraudulent transactions. 9, Optimise the Performance of Machine and Equipment Big Data analysis can also make machinery and equipment to be self learning and operating more intelligently and autonomously. For example, Big Data tools have been used by Google to develop its driverless car. Toyota's Prius hybrid car is equipped with a smart camera, GPS and sensors to make the car to be able to drive more safely with minimal human intervention. Big Data applications do not just stop here. The fact is that - how we can make meaningful use of Big Data is only limited by our own imagination and creativity. Otherwise, be prepared to see more innovative Big Data applications. China is outsmarting America in artificial intelligence
Soren Schwertfeger finished his postdoctorate research on autonomous robots in Germany and seemed set to continue his work in Europe or the United States, where artificial intelligence was pioneered and established. Instead, he went to China. "You couldn't have started a lab like mine elsewhere," Schwertfeger said. The balance of power in technology is shifting. China, which for years watched enviously as the West invented the software and the chips powering today's digital age, has become a major player in artificial intelligence, what some think may be the most important technology of the future. Experts widely believe China is only a step behind the United States. [ Read more ] Big Data Space (BDS) achieves another milestone in June 2017 BDS is now a reseller of MailGuard products and services. 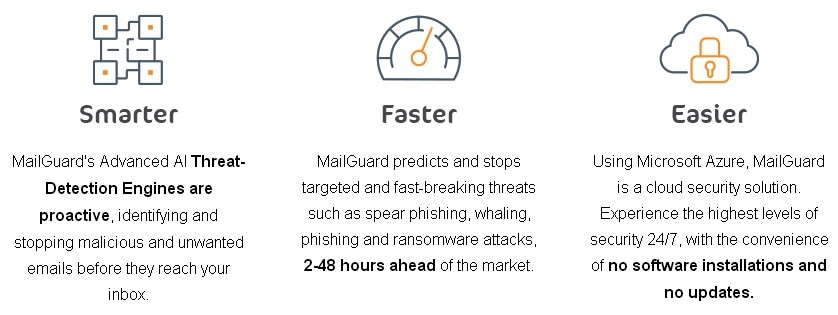 MailGuard is a dedicated Australian owned Cloud security provider who, since 2001, has stopped spam, viruses, ransomware, spyware, malware, phishing, and spear phishing impacting businesses around the world. MailGuard are also continuing our daily defences against spam and malware, and the very common phishing and crypto viruses which are still plaguing Australian businesses. Our Edge in the market: o Australian owned and operated o Complete multi-vector protection across email and web o Platform independent integration with on-premise (Exchange) and hosted mail (Office365, Google Apps) o 2-48HRS AHEAD OF THE MARKET IN PREVENTING FAST-BREAKING ATTACKS o Simple setup and intuitive unified console for web and email management o Set and forget (there’s no hardware, no software, no installation, no upgrading ever) o Hybrid AI technology that provides customers with continuous real-time detection, prevention and response o Viruses and malware eliminated before reaching the network o Reliability – we have an uptime of 100% and have not experienced a total customer outage in over 10 years o Business continuity providing zero email downtime during times of email server or hosting provider failure o Bandwidth and acceptable usage control o Outstanding 24x7 customer service withy 98% first call resolution and an Net Promoter Score (NPS) of 64+ MailGuard is different to traditional antivirus. A cloud-based email and web solution, partnered with smart Hybrid AI threat detection engines that predict, learn and anticipate new threats as they are emerging. This cloud-based layer of security means MailGuard can apply immediate protection against emerging threats, to users across 27 countries around the globe. Internet of things a cyber risk for companies
Earlier this year, guests at the lakeside Romantik Seehotel Jaegerwirt hotel in Austria were locked out of their rooms after hackers broke into the hotel’s electronic key system and demanded a ransom to unlock the doors. In March, personal information including email addresses and passwords, was leaked along with access to profile pictures and more than 2 million voice recordings of children and adults when internet-connected toy maker CloudPets suffered a security failure. Hackers demanded a ransom or they would expose the data. Both the hotel locking system and the children’s toys relied on the Internet of Things, where everyday devices are connected to the internet to allow them to communicate with or be controlled by computer systems. IT security experts say companies are vulnerable to being hacked via Internet of Things (IoT) devices as their use increases, sometimes without adequate security controls. “The Internet of things has the potential to increase the attack surface exponentially because we’re potentially talking about many, many devices that have internet connectivity,” says Scott Ceely, managing director of IT security consultancy Seer Security. The IoT potentially allows hackers to damage not just a company but also its customers, for instance by hacking into a car’s GPS system or into medical devices such as pacemakers. “The real concern now is about the flood of products into the market that potentially just aren’t safe, for a variety of technical and also privacy reasons,” Ceely says. In fact, late last year the Privacy Commissioner examined 45 different IoT devices, including fitness and health monitors, smart travel locks and thermostats, from both multinational and start-up businesses and found 71 per cent of them did not provide a privacy policy that adequately explains how personal information is managed. Hackers can also use the Internet of Things to gain entry into an organisation’s overall computer system, says Michael Shatter, a partner in risk advisory services at RSM. “The way to think about an attack is that you’re not always going to go straight towards the safe. Sometimes, to get to the safe, you might have to go via the drawer because in the drawer, there might be a little black book that’s got the code for the safe,” Shatter says. Even something as commonplace as a photocopier and printer can add to a company’s vulnerability, as these are connected to the network and often don’t have security controls. “What we often do now when we scan an environment during one of our penetration testing attacks, we actually focus on those devices because those devices may have default passwords and credentials,” Shatter says. “These are very useful attack vectors for people with illegitimate objectives to try and gain access to what would otherwise be considered a secure environment.” The looming introduction of mandatory data breach notification, expected early next year, has also put a spotlight on cyber security. Under the bill which was passed by Parliament in February, businesses and government agencies will be required to notify the Privacy Commissioner if they suffer an eligible data breach. They also have to notify affected customers “as soon as practicable” after becoming aware a breach has occurred. The legislation covers government agencies and organisations governed by the Privacy Act, although companies with a turnover of less than $3 million are exempt. A failure to comply with notification rules can incur fines of up to $360,000 for individuals and $1.8 million for organisations. Kelly Butler, Managing Principal & Cyber Leader at insurance broker FINPRO Marsh, says there is a heightened awareness about cyber risks and more companies are seeking out specialist insurance. While some general business insurance policies carry cyber extensions, these often only cover the expenses incurred by the company itself in the event of a cyber breach. “Those extensions don’t really offer the full scope of what a cyber policy is meant to do and a cyber policy in my mind is really plugging the gaps of those traditional policies that haven’t really evolved with the world and technology and aren’t adequate enough in terms of looking at the cyber risk that clients now face,” Butler said. They cover expenses involved with a cyber breach, such as the cost of notifying the Privacy Commissioner and customers, business interruption, the cost of IT and crisis consultants and the cost of defending a prosecution for the data breach and fines. Cyber extortion is usually included, such as if a company’s data is stolen and a ransom demanded. Insurance can include the cost of negotiating as well as any eventual ransom. Importantly, cyber policies generally cover third-party expenses, such as if customers suffer a loss or damage because their personal or financial data has been compromised. Butler said the internet of things is a new area for the insurance sector, although some insurers already offer policies that cover third party damage arising from IoT hacking. Source: http://paidcontent.afr.com/liberty-international-underwriters/business/article/internet-things-cyber-risk-companies/ Disclaimer: The above article is published here in addition to providing a link in other pages of Big Data Space website so that visitors can still read the article in the event of having a broken link to the original article. Another area of interest of mine is the Internet of Things (IoT). There are many articles written about IoT, but I like this article for its good coverage:
What is the Internet of Things (IoT)? It covers: > Terms and Basic Definitions > IoT Predictions, Trends, and Market > IoT Industries > IoT Companies > IoT Platforms > IoT Security and Privacy Google billionaire Eric Schmidt says this is the skill employers will look for in the future
If you want to pick up the skill more employers will be looking for in the future, heed the advice of executives from a global leader in technology. In an interview with CNBC, both Eric Schmidt, executive chairman of Google's parent company Alphabet and Jonathan Rosenberg, adviser to CEO Larry Page , say that data analytics will become increasingly important in workplaces. "I think a basic understanding of data analytics is incredibly important for this next generation of young people," Schmidt tells CNBC. "That's the world you're going into." "By data analytics," the executive chairman says, "I mean a basic knowledge of how statistics works, a basic knowledge of how people make conclusions over big data." Focusing more on data analytics will help businesses too, the executives say. Hiring professionals with the right skills and a penchant for bold, creative thinking was a strategy that drove Google's innovation, Schmidt and Rosenberg write in a recently updated version of their book, "How Google Works." According to the Bureau of Labor Statistics (BLS), the number of roles for individuals with this skills set is expected to grow by 30 percent over the next seven years, well above average. Data analysts make sense of large amounts of information using statistical tools and techniques. They're able to pinpoint trends and correlations using programs such as Excel, SAS and SQL and Tableau. They typically study statistics, data science or math. Schmidt says that being able to use calculus would be a great asset to an employee, but an understanding of how to approach big data would still be very helpful in finding a job. Rosenberg agrees. "My favorite statement that echoes Eric's," he says," is 'Data is the sword of the 21st century, those who wield it well, the samurai.'" The quote comes from an internal memo Rosenberg sent to employees in 2009, following the inauguration of President Barack Obama. "Everyone should be able to defend arguments with data," he writes in the memo. "Information transparency helps people [...] determine who is telling the truth." Source: https://au.finance.yahoo.com/news/google-billionaire-eric-schmidt-says-171636125.html Disclaimer: The above article is published here in addition to providing a link in other pages of Big Data Space website so that visitors can still read the article in the event of having a broken link to the original article. Due to busy schedule, I have not posted any blog in March 2017.
Today, I want to share an article titled Wide vs Long Data. It is an eye opener that there are so many ways to describe and present data. An abstract of the article: Wide & Long Data Contents Wide versus long dataA case for long dataWide to long conversionExercises Summary This tutorial has three purposes: to explain the difference between long and wide form datasets, to show why it’s generally preferable to use long form datasets, and to go over how to convert datasets from wide to long form. Click here to read full article. Using Big Data to Optimise Road Improvement Spend Data collection and analysis that would have taken months can now be performed in seconds. And big data can help planners and funders ensure that road infrastructure spending is optimised and society gains the most. Economics is the study of scarce resources, and what is more scarce than our roadways. For example, in England the Strategic Road Network represents just 2% of all roads but carries over a third of all traffic and two thirds of all freight. [ Read more ] |
